CREWS 5: Four Main Drivers Of Total Costs
OVERVIEW
DRIVERS OF TOTAL COSTS
How do we know:
• What is driving our Total Costs?
• What connects drivers with each other?
• How do we change upstream cost drivers?
In the classic axiom, if you want something good, fast, and cheap, you need to give up one of the three. This is why optimization is a core competency of the CREWS professional, who must properly balance three goals:
1. Effectiveness (High Quality)
2. Efficiency (Fast Delivery)
3. Economy (Low Costs)
This raises important basic questions, each with a strong impact on costs:
1. Are we achieving reasonable levels of quality in our service levels?
2. Are our service schedules and response times appropriate?
3. Does our space reflect the actual needs of the business?
There are many other, regular management practices which must be exercised for successful cost control, such as strategic outsourcing, regular budget reviews, bidding and cost reduction initiatives. The above questions, however, are often assumed to be answered at the right levels but levels may exceed the optimal balance.
For example, cleaning frequencies can be adjusted downward until an acceptable lower limit has been reached. Some areas may require little or no cleaning, and this can also be reflected in the contractual area (i.e. SF) being cleaned. Maintenance schedules can be changed from regular replacement of older equipment to a flexible, “Run To Intelligent Failure”mode (RTIF) for non-critical items such as bathroom exhaust fans.
COMPOUND COSTS
Achieving the right balance of compound factors has a cumulative benefit, somewhat like compound interest, which Albert Einstein called the “eighth wonder of the world.”
As an illustration, assume that rising costs of labor & materials (and perhaps interest rates) drive up the costs of CREWS services by (say) 10% in the current year. At the same time, assume the amount of space required also increases by 10%, due to returning workforces and a simultaneous desire for more personal distance between workspaces. Finally, include an additional 10% increase in cleaning, maintenance, employee services, utilities and other CREWS costs, due to the need for more frequent and/or increased levels of services.
Compounding these factors results in a total increase of over 33%, due to the effects of each on the others. The math is very simple, but can easily be overlooked if each of these challenges is addressed separately.
This is where Visual Management helps, by making such effects more obvious. Imagine a three-dimensional cube with three cost drivers of X (representing service levels), Y (for costs) and Z (for effective quality, i.e., customer satisfaction). Total volume represents Total Costs of three combined factors. Note: Total CREWS Costs actually have four main drivers to optimize: Services, Occupants, Space & Workplace.

FOUR MAIN DRIVERS OF TOTAL COSTS

SERVICES
ANALYZING COSTS
Each of these four factors has internal cost drivers which determine how much costs can be reduced. These can be considered arrows in the direction of cost increase. Services, for example, are driven largely by the scope of services offered, and by the levels of service provided. The product of these factors, multiplied by unit costs (per SF, per person, etc.) is the Total Cost for each service

Scope of Services and Service Levels can be reviewed in detail to determine whether reductions are possible, either in the SF served (e.g. HVAC on vacant floors), or the level of service provided (control of downtimes, response times, workorder backlogs, unplanned corrective maintenance, etc.) See the example following.

*Note: For lists of services other than Maintenance & Operations see previous chapters CREWS 3 & CREWS 4.
CONTROLLING AND REDUCING COSTS
As noted above, there are many management practices which must be exercised for successful cost control, such as strategic outsourcing, regular budget reviews, bidding and cost-reduction initiatives. There are, however, upstream factors which can be more important, but whose combined effects are easily overlooked.
Consider the scope of services, such as which areas on which floors are actually in need of HVAC, cleaning, etc., and which hours of operation. Review the level and frequency of services actually necessary for effective operation and usefulness. In this example, both scope and service level reductions of 15% are possible.
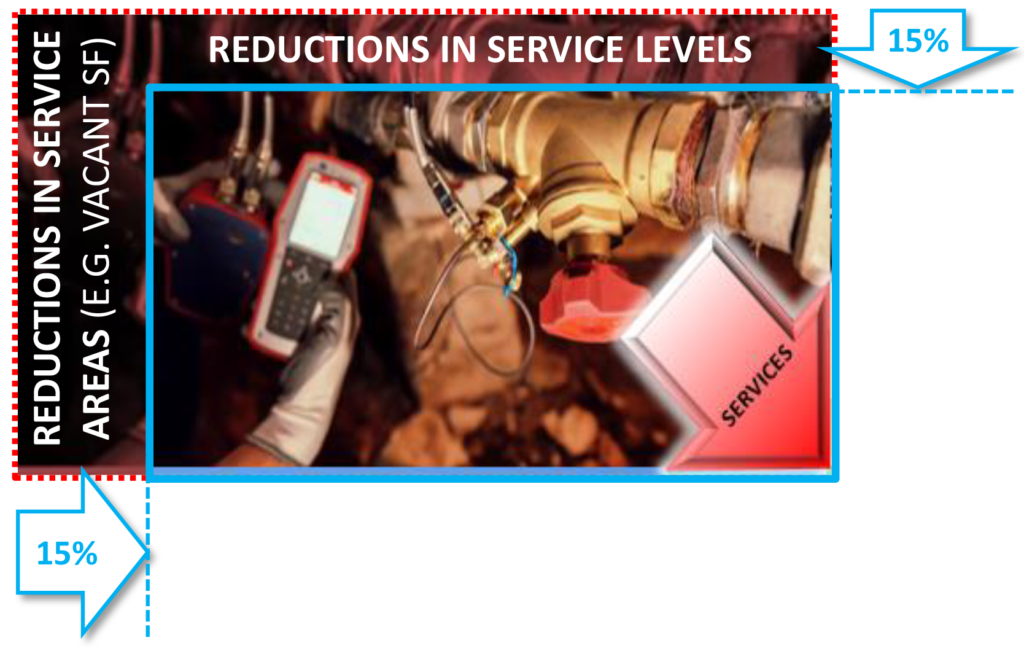
The combined cost reductions equal 1 – (.85 x .85), or nearly 28%.
OCCUPANTS
Internal cost drivers for Occupancy are complex. Some of them are addressed in other sections, such as services (discussed above), space requirements and workplace design (both discussed below). In this section, we examine the element of Time, which has become extremely important in the Covid and post-pandemic era.

ANALYZING OCCUPANCY
The diagram below graphically depicts an algorithm developed by Guerin Associates for its “Prismetrix” data management program. A large gap exists between Peak Occupancy (or “Net Equivalent Occupants”) and the number of workers who might appear on-site at any given time. This gap represents a significant opportunity.
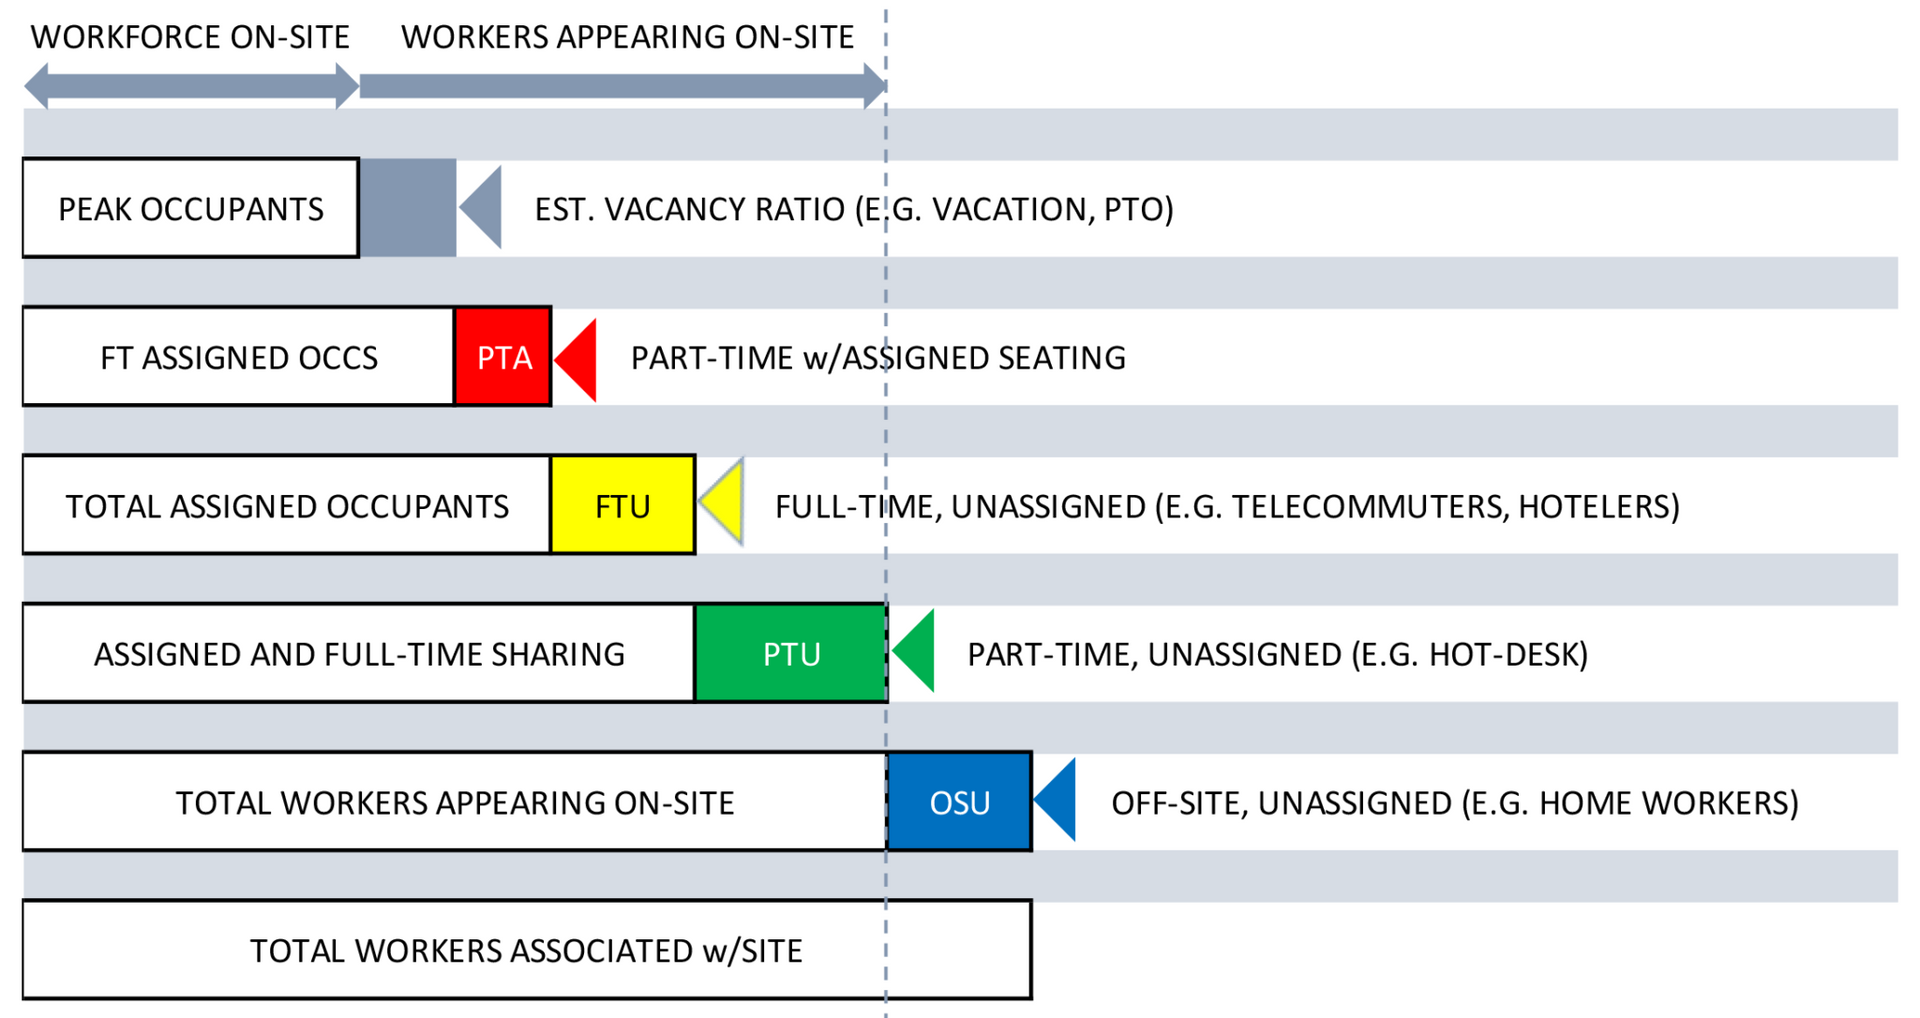
apitalizing on this opportunity requires time-based data collection, documenting workspaces and population on-site over extended time periods, including 2nd or 3rd shifts if used. This enables flexible assignment of workspaces, reservations and time-sharing of spaces, team scheduling and disposition of excess workspace.
SPACE
Space is the major factor when changes in a portfolio are being considered. Cost drivers escalate during the programming, design, construction and occupancy of facilities. As each phase is completed, changes become more expensive to execute. The most significant factor is Gross Square Footage (GSF), or exterior footprint of the building. This series of measures concludes with Net Assignable SF, the total SF of individual workspace.

The Gross / Net ratio varies dramatically from one building to another, between similar buildings of the same company, or even on the same campus. We refer to the ratio of Gross SF to Net Assignable SF as the GPA, or “Guerin Prism Average.” Analyzing what drives a high ratio requires more than traditional “rules of thumb.”
ANALYZING SPACE
This diagram illustrates the “Guerin Prism,” a graphic algorithm for in-depth analysis of space utilization. Each level generates data which is compounded at subsequent levels. Excessive space at any level is thus expanded by “markup factors” at the following levels, increasing the overall costs of design, construction, occupancy, operation and life cycle costs of facilities.
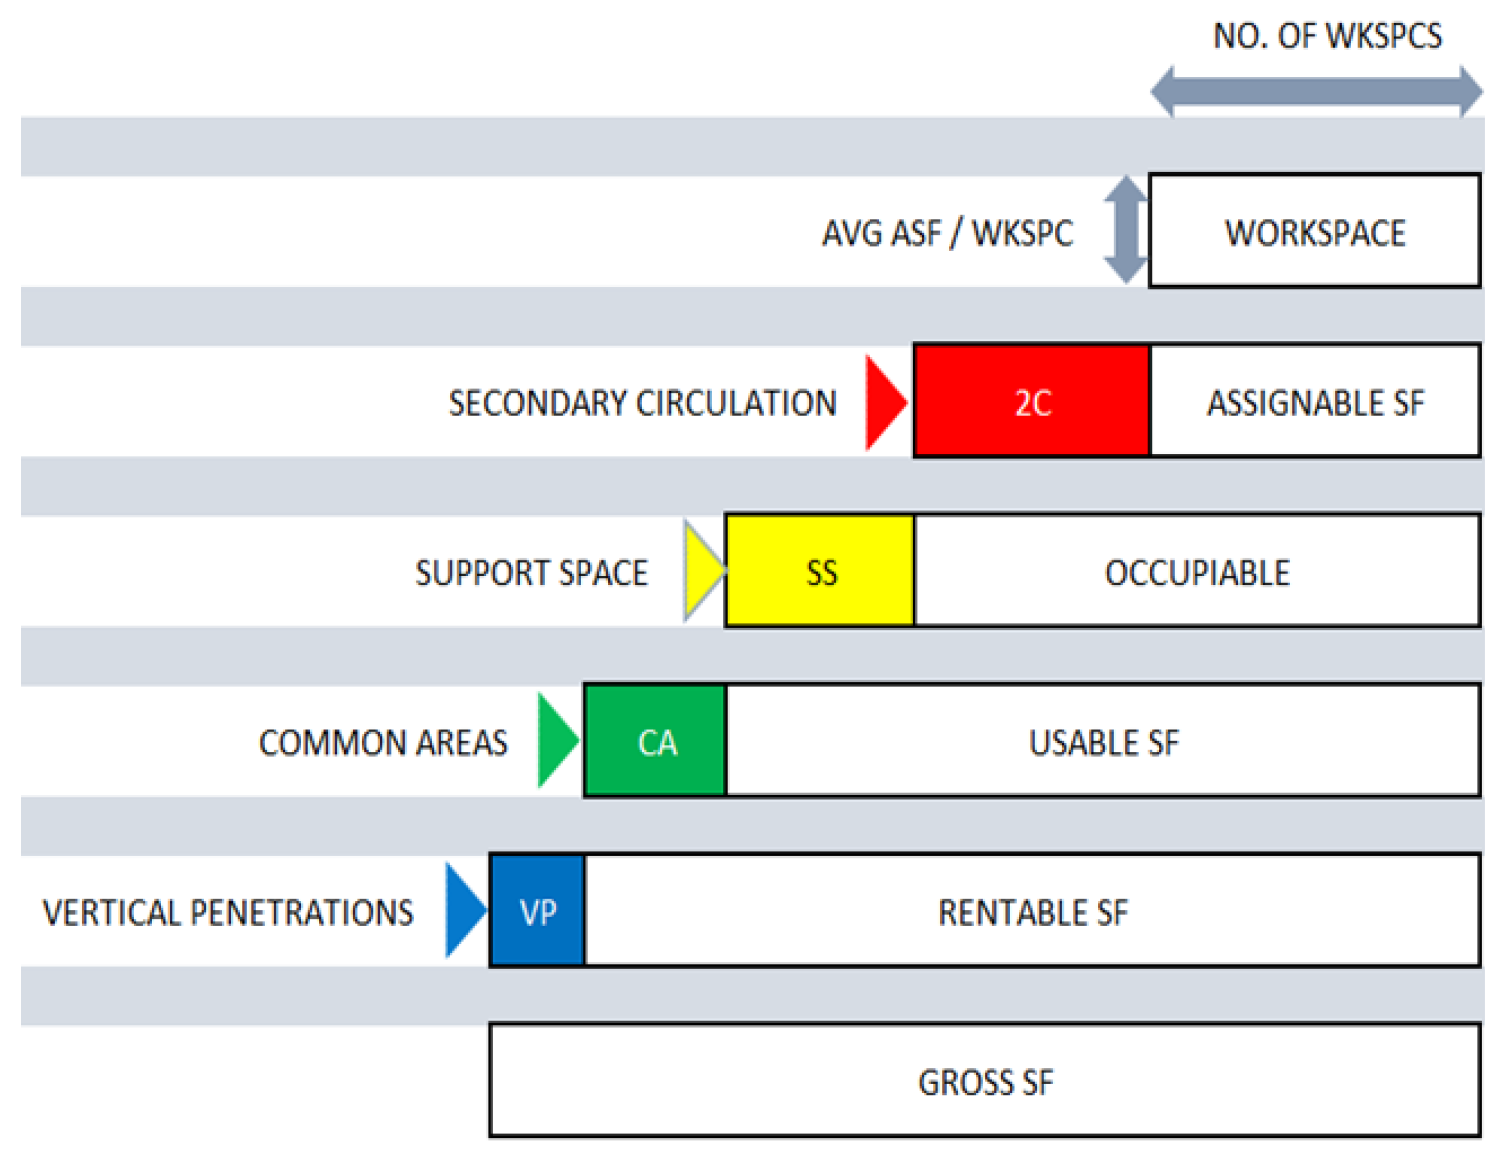
There are many reasons for a high GPA ratio, and most can be identified through a design peer review. For example, the Perimeter Area Ratio (Lineal feet of perimeter wall divided by the square root of the floor area) can indicate a very irregular footprint – something like gerrymandering. “Space is free and easy; walls are not.”
WORKPLACE
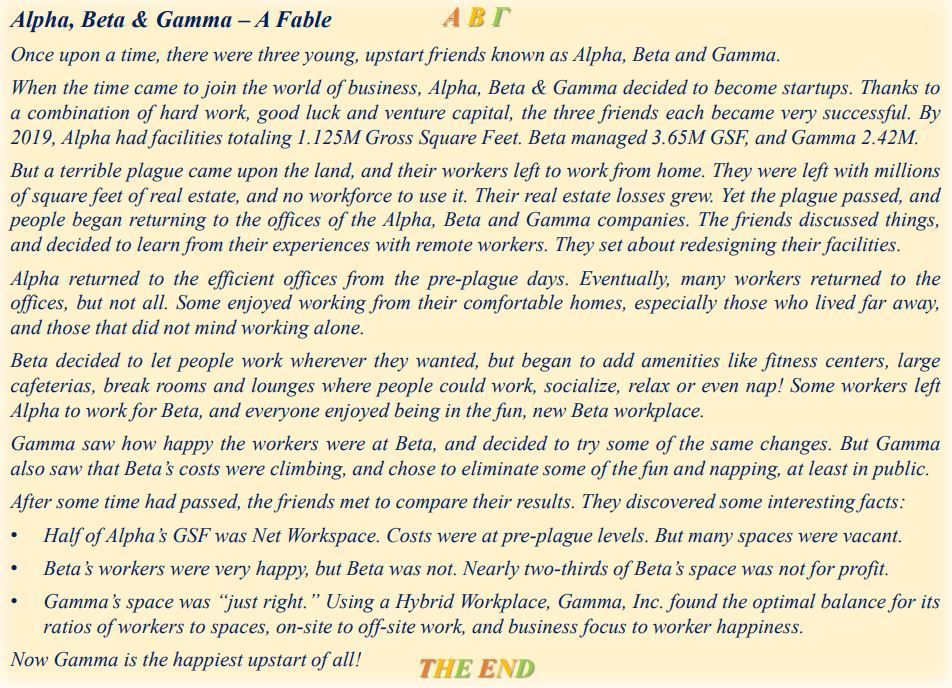
As workers return to offices, labs and other corporate spaces, they bring new attitudes and habits regarding work, new relationships with colleagues, and new ideas about what makes the Workplace worth returning to. Most companies are planning a “Hybrid” environment, allowing employees to plan flexibly around personal needs and schedules, and coordinate with co-workers to seamlessly plan collaborative, in-person sessions.

Achieving the optimal fit between a facility and its occupants involves new considerations of timing, as well as the sizes and types of workspaces being provided. Different degrees of privacy, collaboration, and conference sessions of varying size are further complicated by the nature of work being done and even workers’ personalities.
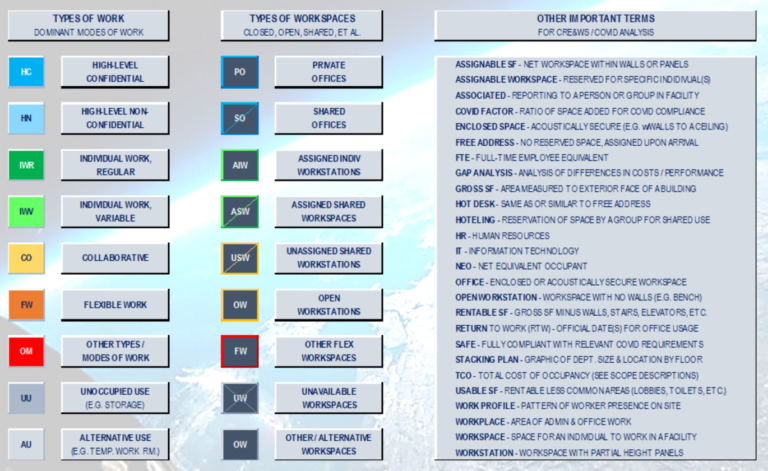
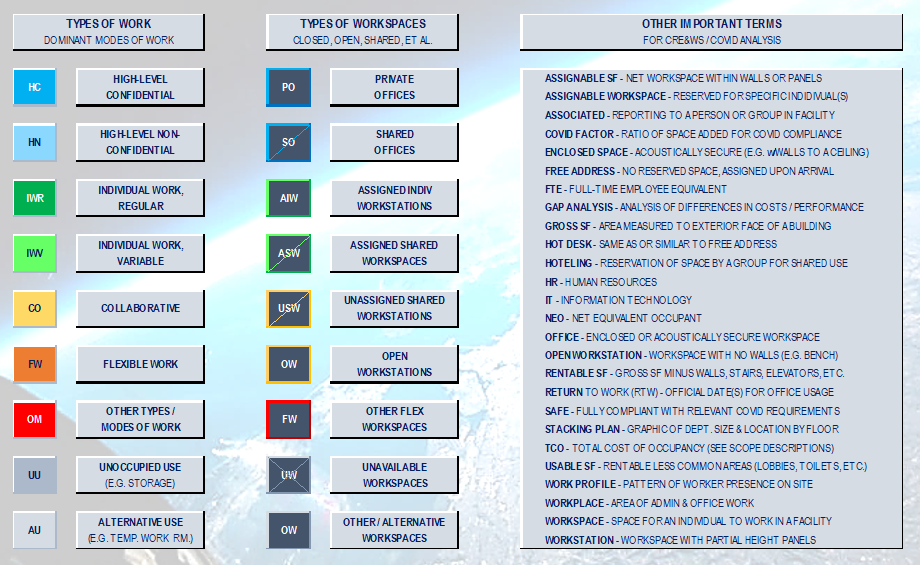
ANALYZING THE WORKPLACE
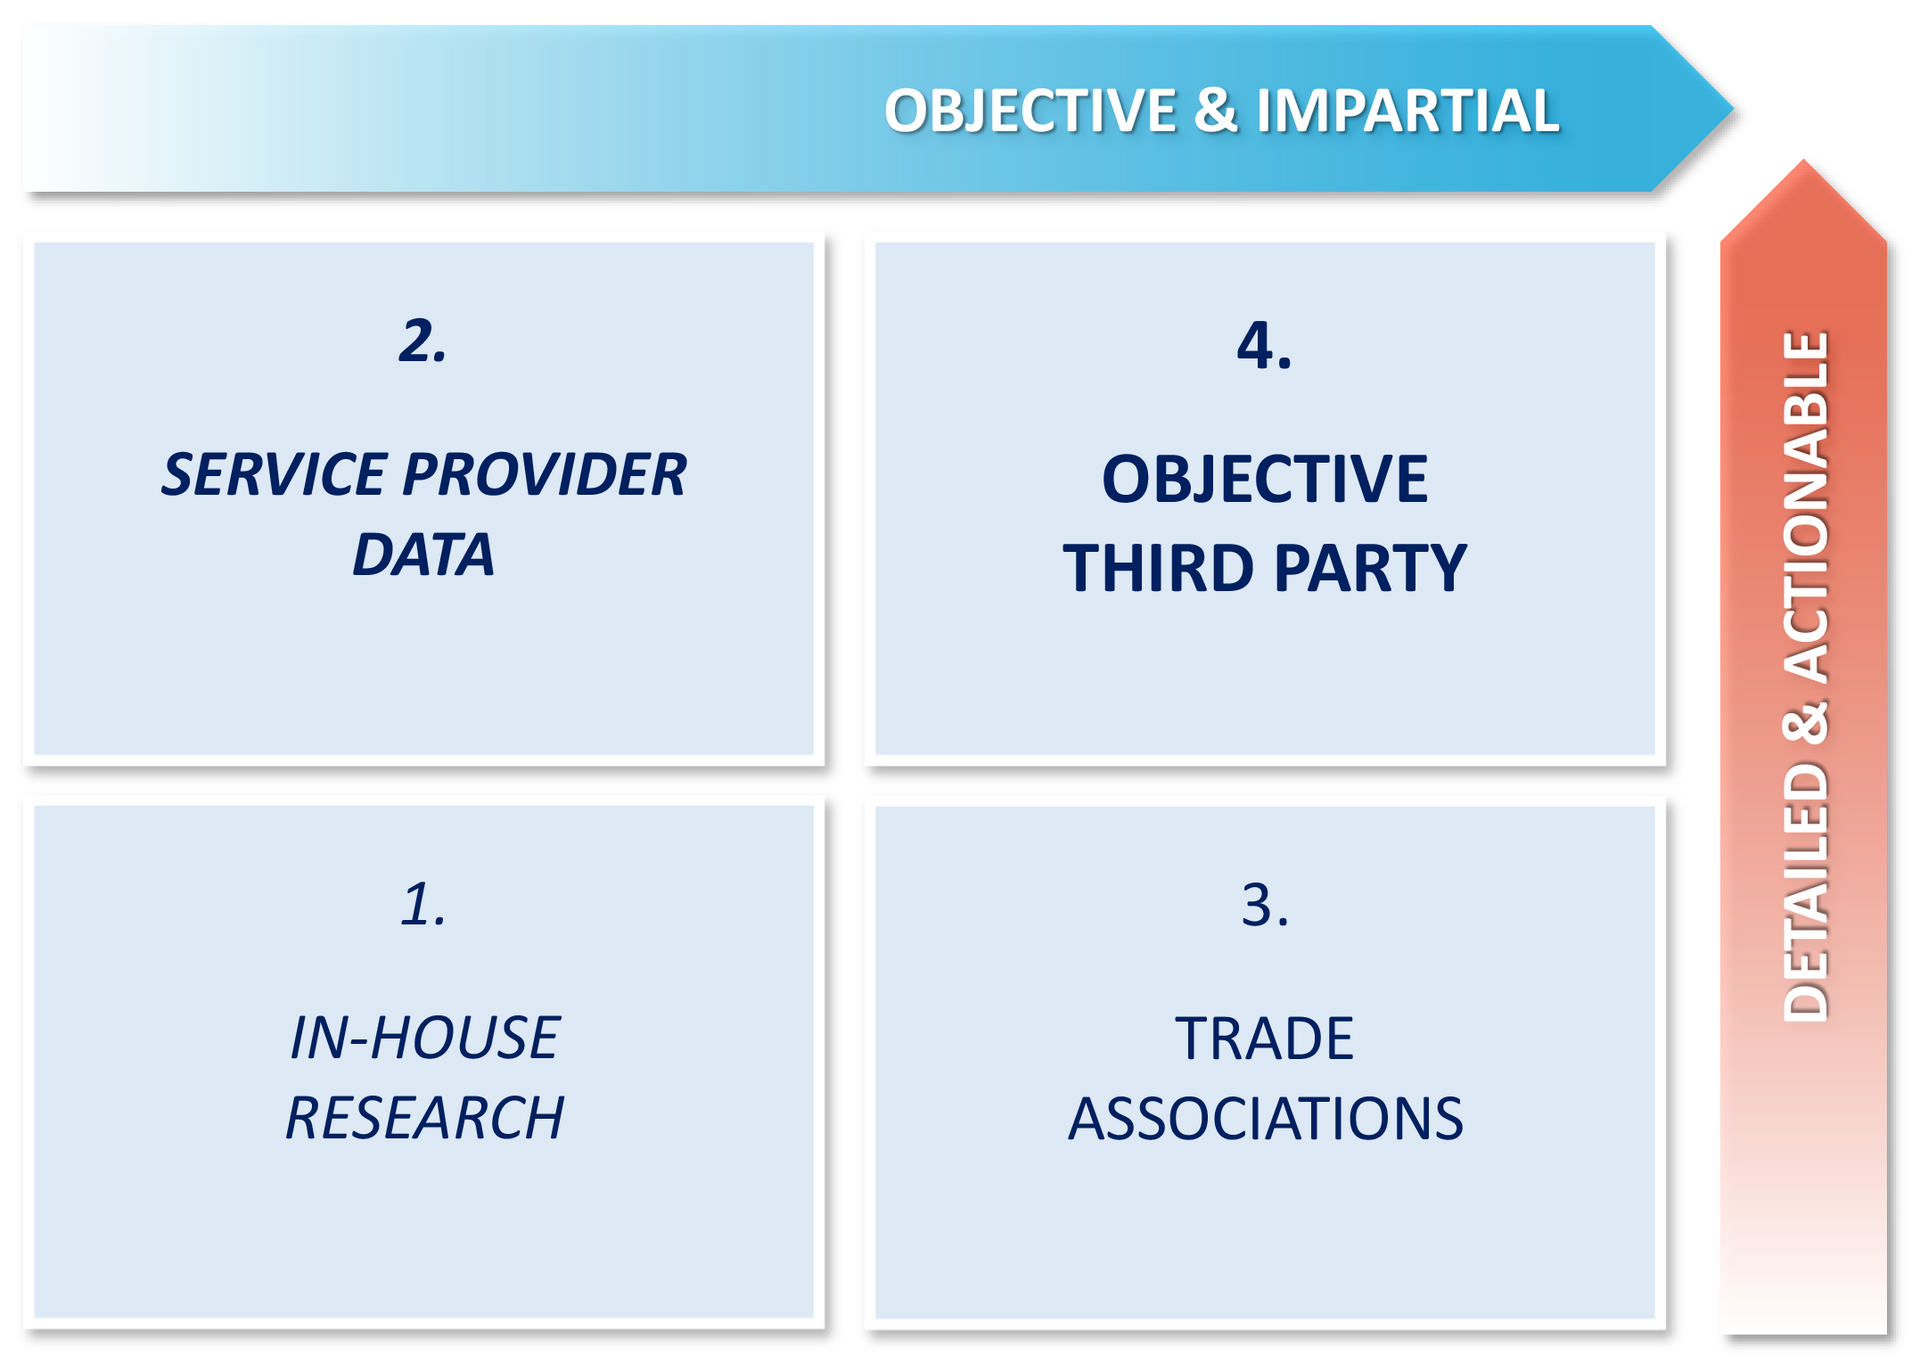
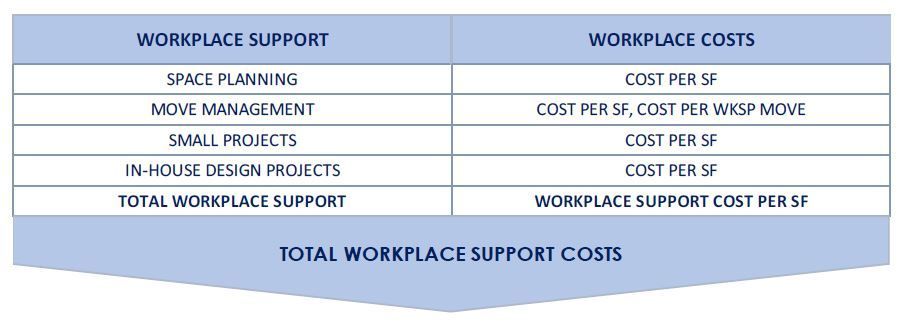
Programs are emerging to help companies initiate, monitor and fine-tune the work / workplace / worker fit. The diagrams below provide a Taxonomy of terms and factors for selecting or self-performing these programs.
TOTAL COSTS
BASELINE TOTAL COSTS
Each of these four factors shown has an impact on Total Costs, and each factor affects all of the others. Control of those costs can be viewed as an arrow representing reduction of each factor to its lowest acceptable level. Total Costs are the product of compounded costs, which then represent the lowest acceptable baseline.
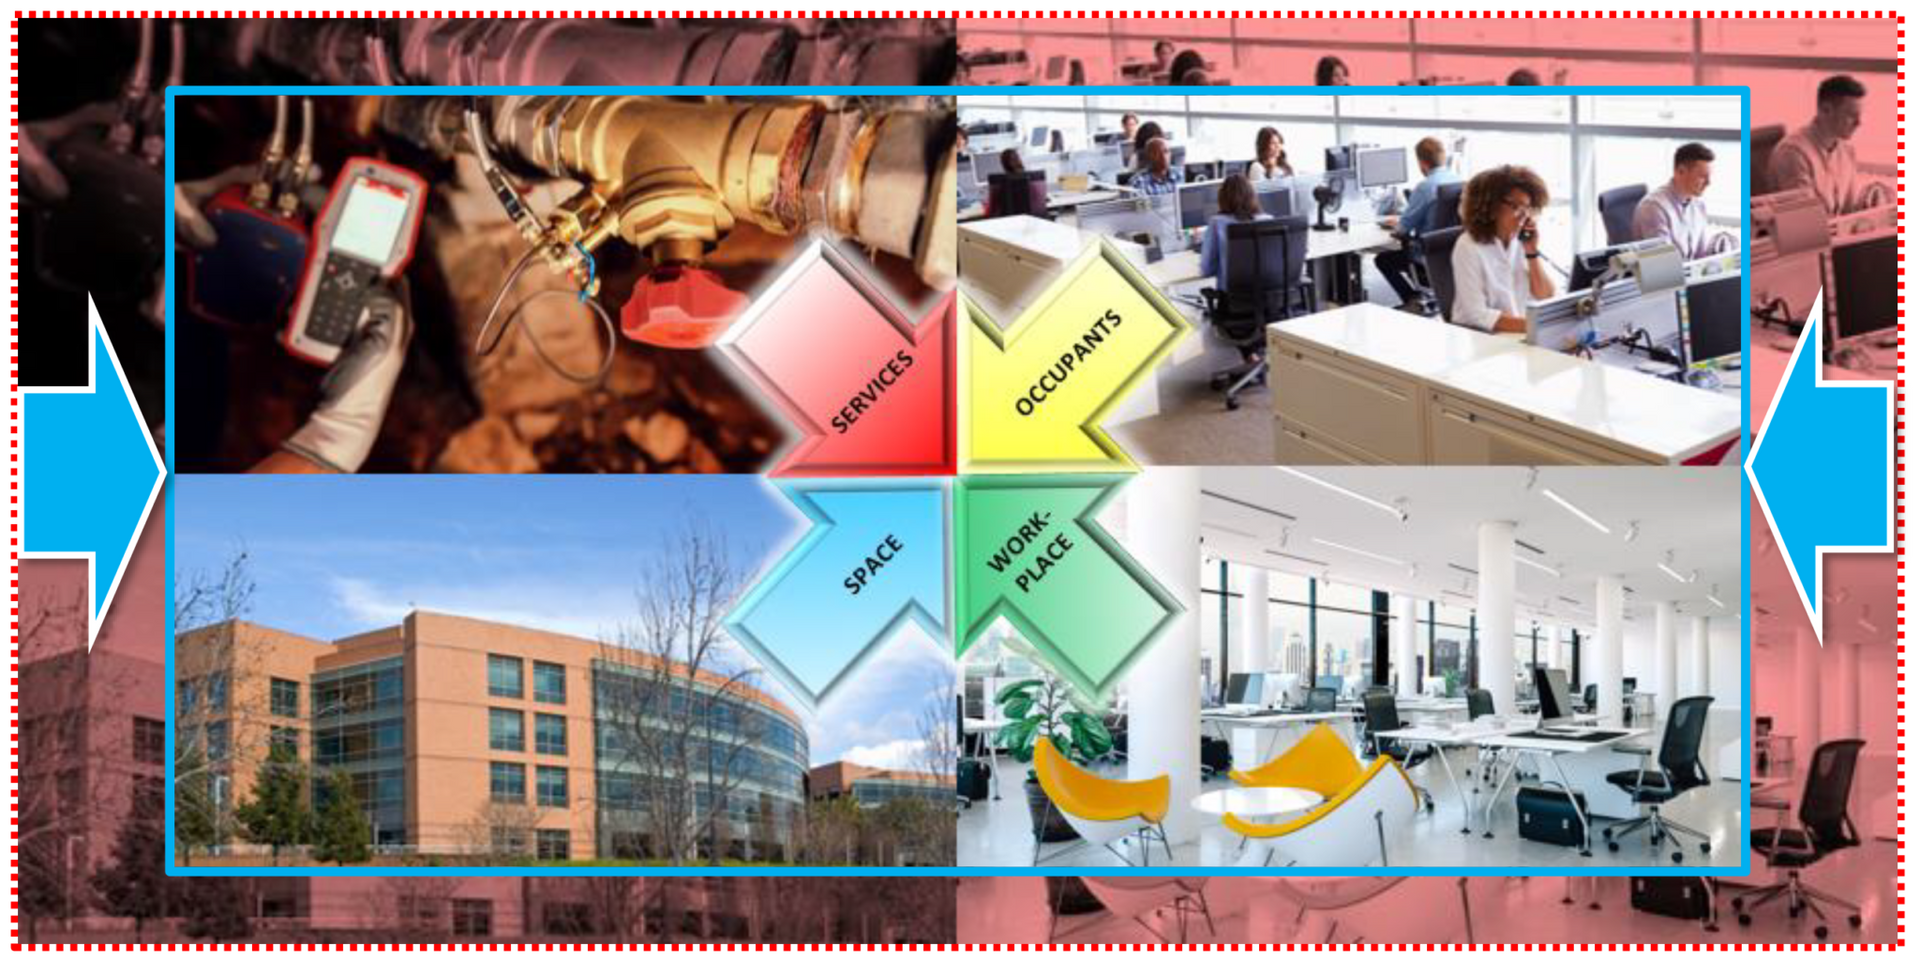
The inner rectangle represents the effect of reductions in all factors. The reduced area (blue vs red) represents the Baseline Total Cost. The red area visible outside of the shape represents significant potential cost savings.
CONCLUSION
WHY IT’S IMPORTANT
We have noted earlier that it’s essential to establish measurable goals and achievements. For a successful effort, it’s important to establish a consistent set of measurement standards that will enable accurate analysis.
The measurements shown here are based on recognized and accepted standards. This is important in achieving “apples-to-apples” comparisons among your own facilities, and even more so when comparing with peer firms.
Once a data management program has been established, in-depth analysis of costs is possible. A consistent approach makes the compound cost analysis shown here easier. Addressing each factor separately, and then combining the mutual effects of each, makes a rigorous, disciplined approach to cost control attainable.

HOW WE CAN HELP
We’ve conducted studies for a wide range of firms, many of them leaders in their industries, who recognize the need to retain a leadership position. We provide them with rigorous, thoughtful evaluations based on our 25+ years of experience, plus our prior hands-on knowledge of the field.
We offer detailed comparisons in all four of the areas above: Services, Occupancy, Space & The Workplace. Space utilization analysis has identified potential savings for clients valued in tens of millions of dollars.
Our evaluations show how to raise performance while reducing costs, by establishing and attaining aggressive but achievable goals for the organization. We can tailor an evaluation to your own portfolio, facilities, workplace, workforce and current needs, and help you become a best performer
THANK YOU!