CREWS 7: Benchmarking – What, Why & How
OVERVIEW
BENCHMARKING – WHAT, WHY & HOW
What is Benchmarking?
Benchmarking has been defined in various ways. One definition is:
Benchmarking is the methodical comparison of an organization’s data with others, objective analysis of differences in results, identification of opportunities to improve, and an effort to learn from best performers.
Another version is “being confident enough to compare with others, and humble enough to learn from them.”
Benchmarking has numerous analogous processes and comparative information sources. Many of these are so familiar that we fail to recognize the parallels. A few common examples include:
- Comparisons of business results, annual reports, financial analysis, etc.
- Investment advice, risk/return evaluations, prospectus reports, etc.
- Health assessments, BMI index, EKGs, laboratory bloodwork, etc.
- Sports analysis, team rankings, performance evaluations, and projections
These examples have one thing in common: Their value depends on being impartial. When a presentation is an effort to persuade rather than inform, it’s actually a sales process, and “free advice” is rarely free of bias. Benchmarking is more like a fiduciary, whose objective is simply to establish the truth in clear, useful ways
Why engage in benchmarking?
The main reason to participate in benchmarking is to acquire reliable, impartial information on one’s performance from the perspective of an objective source. It’s easy to be deluded about our performance by our own biases or those of others seeking to persuade us to use their product or service.
Another concern is the issue of confidentiality. Using a third party safeguards identities of study participants. This allows sharing of detailed data and increases the accuracy and actionability of results without fear of vulnerability from what is revealed. Confidential “masking codes” make this process secure for all parties.
How can we participate in Benchmarking?
Types of Benchmarking
1. Internal comparisons – Among different regions, campuses, or buildings within a portfolio, for example
2. Peer comparisons – Among similar facilities or campuses within a sector, industry, or business
3. Targeted comparisons – Among specific building areas (e.g., labs) or activities (e.g., HVAC energy use)
4. Other – Organizations of common interest, such as public sector, academic, urban locale, climate, etc.
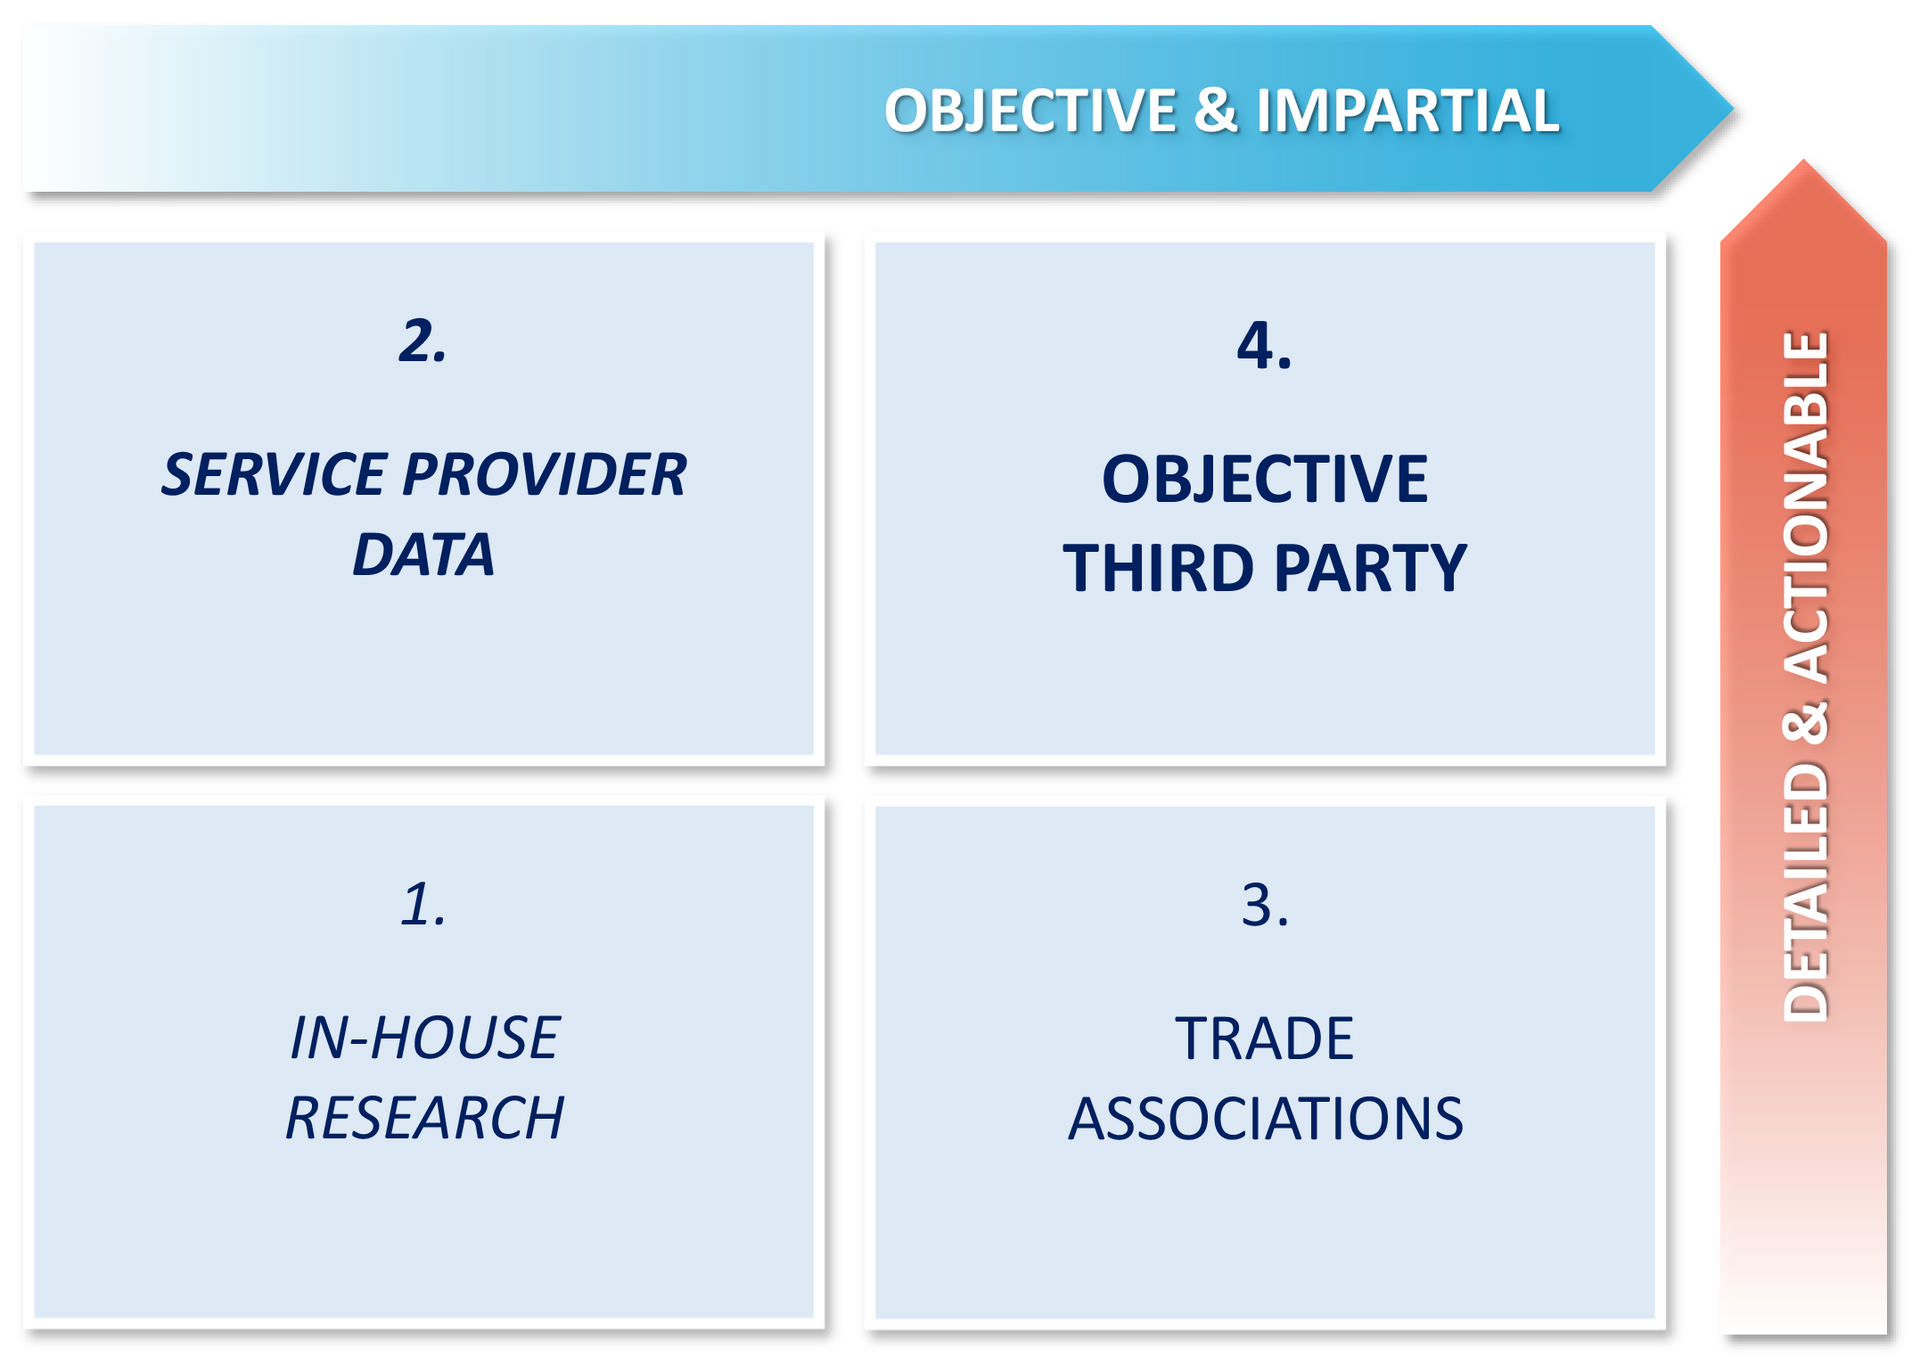
Sources of Benchmarking (See Diagram on Next Page)
1. In-House Benchmarking Research – Some organizations assign their own internal staff to conduct benchmarking comparisons. Although convenient, the interpretations of findings may be influenced by desired outcomes (such as maintaining the current organizational structure, for example).
2. Service Provider Data – Benchmarking data is available at little or no cost from service providers. As with In-House findings, results may suggest staying with (or switching to) the service provider reporting.
3. Trade Associations offer objective information, often at a relatively low cost. This information is impartial but may lack important detail, such as local climate, fuel, labor, or material data, or use definitions varying from those of the organization, which is seeking directly applicable information.
4. Objective, Third-Party Sources offer objectivity and impartiality, plus detailed, actionable information.
a. When an organization elects to sponsor a study, it can define the scope and terms used in the study, the areas being reported, peers chosen for comparison, and the methodology used by the consultant.
b. When participating in a study sponsored by another organization, one can often join at no cost, but cannot determine the scope, terms, definitions, or methods used.
c. A consortium study sponsored by a group has the advantage of shared costs, but must coordinate among the sponsors to achieve a consistent scope and schedule compliance. This can be managed by a local trade group chapter, but can also be coordinated cost-effectively by a third-party consultant.
How do we obtain “apples-to-apples” comparisons?
One of the chief advantages of outside sources, such as trade associations and third parties, is their use of consistent definitions. This ensures that all data collected is based upon the same scope and level of detail.
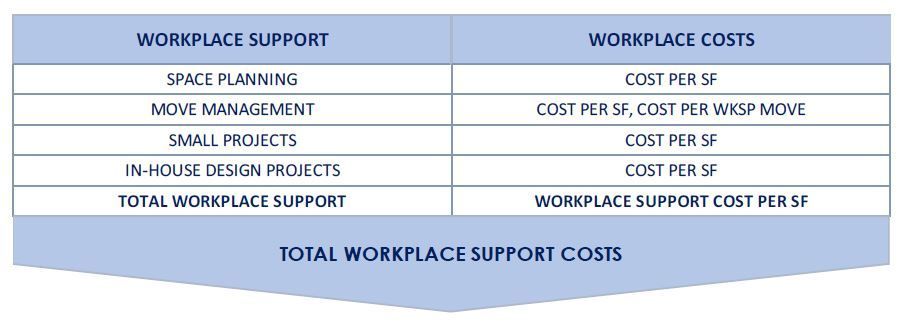
Example: Maintenance & Operations – Cost Definitions
Reported costs include all maintenance, repair, operation of the building(s) and equipment. This includes roofs, walls, mechanical equipment, elevators, electrical, fire extinguishers and systems, life safety and security systems, building controls, maintenance (CMMS) and automation systems (BAS), painting and finishes, building and site signage, furniture repair, all bulb replacement, indoor plants, pest control, routine waste management and recycling (net costs).
Internal labor and costs include maintenance shops. (Note if materials management is included.) Include any exterior wall cleaning, although window cleaning should be included with
Custodial.
Outsource costs include all service contracts for HVAC, elevator, other, etc. Labor for cogeneration operation should be reported with Utilities labor costs. Note in Remarks any extraordinary expenses, such as unplanned repairs exceeding $50,000 which occur less than once per year. It also includes projects such as equipment replacement in kind, minor construction, or supporting services such as air quality testing, air balancing, infrared, vibration analysis or electrical system diagnosis.
Supplies and Materials includes:
Small tools, uniforms, maintenance materials, repair & replacement parts, etc.
Excluded from reported costs:
Large vehicles and fuels, registrations, etc.
Capital project costs
are reported with
Design & Construction.
How do we measure performance?
While Cost is relatively straightforward, measuring Performance requires establishment of the key metrics to be used, the units of measurement and the weighting of each performance area relative to the others.
Example: Maintenance & Operations – Key Performance Indicators & Targets.
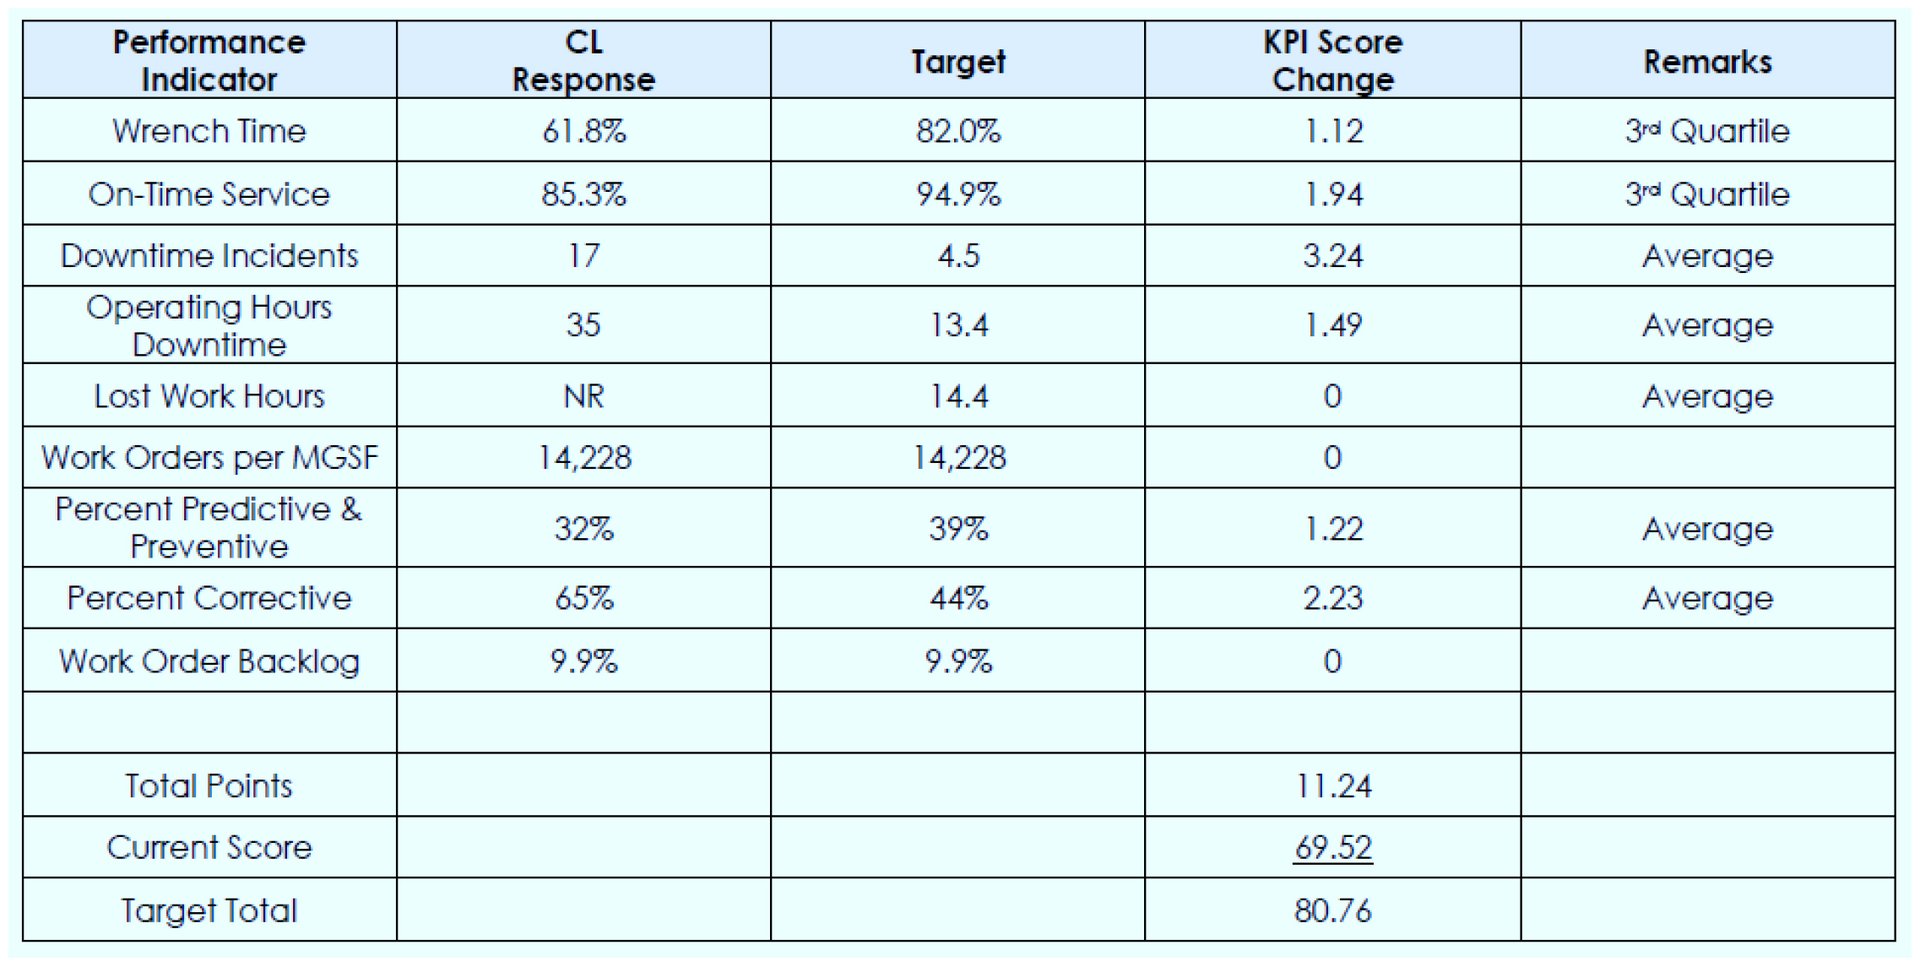
Show here are improvement targets required for a specific client (Company CL) to achieve a performance level of 80.76 out of a possible 100 points. This represents the first of three years of combined cost reductions and service level improvements in order to achieve the top quartile for Value and Best Performer status.
THE PROCESS
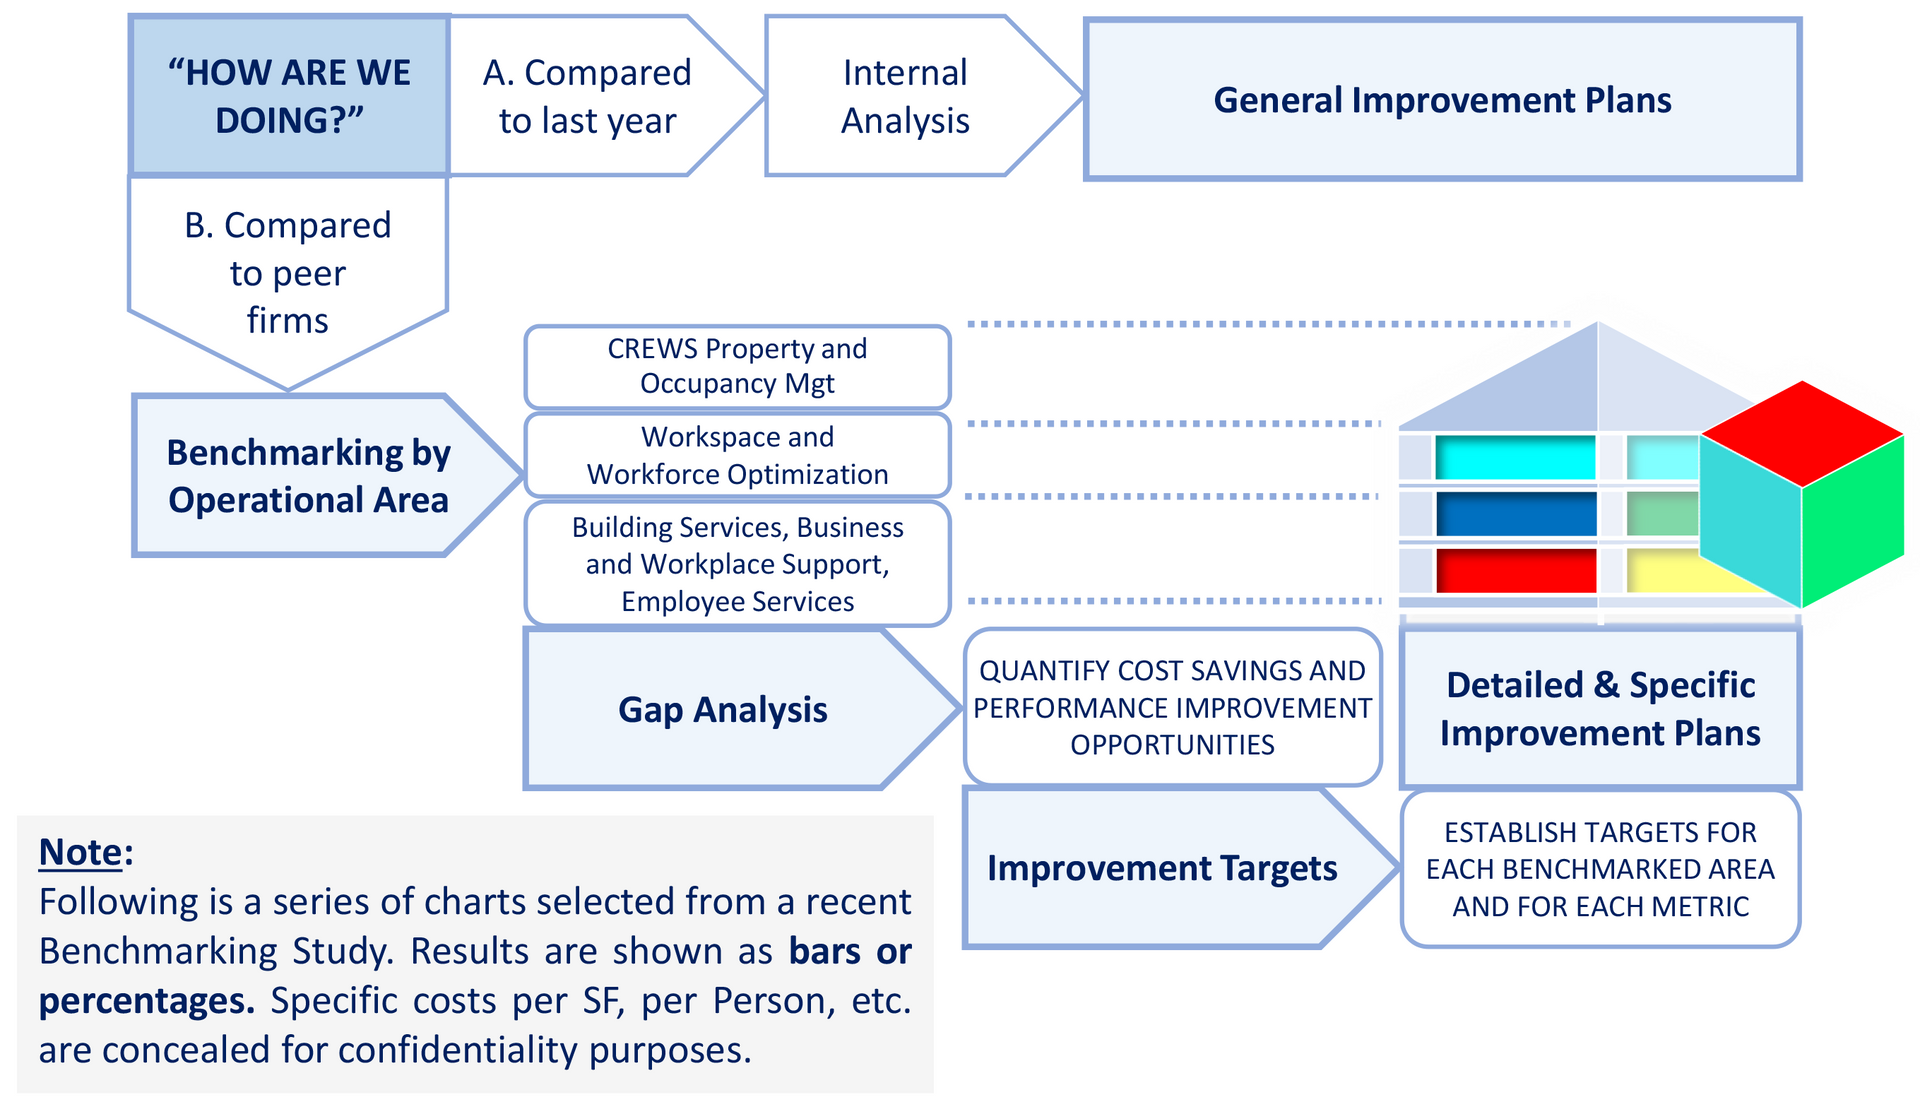
What is the Benchmarking Process?
Here is a generic diagram of two approaches to reviewing organizational performance results:
A. Annual Data vs. Last Year Results; and/or B. Benchmarking Comparisons vs. Peer Firms & Facilities
SPACE UTILIZATION IS A CRITICAL KEY METRIC
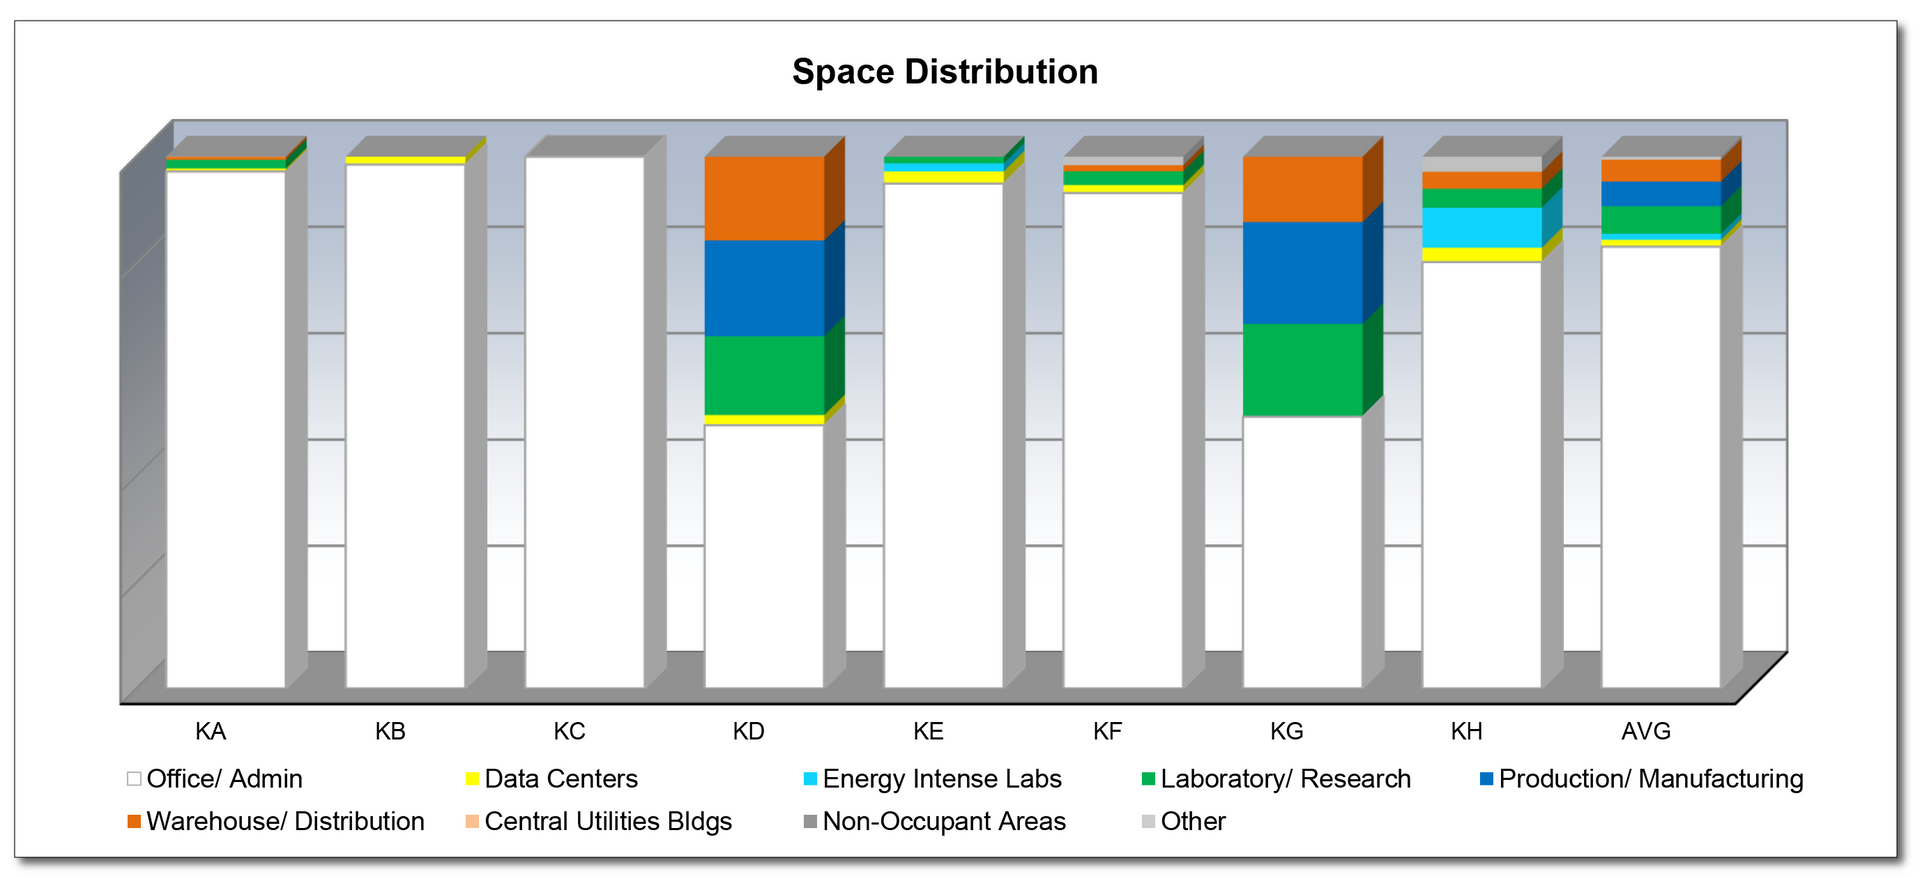
TO BENCHMARK YOUR ORGANIZATION ON THIS OR OTHER CHARTS, CONTACT US THRU “MORE INFO.”
FIXED AND VARIABLE COSTS
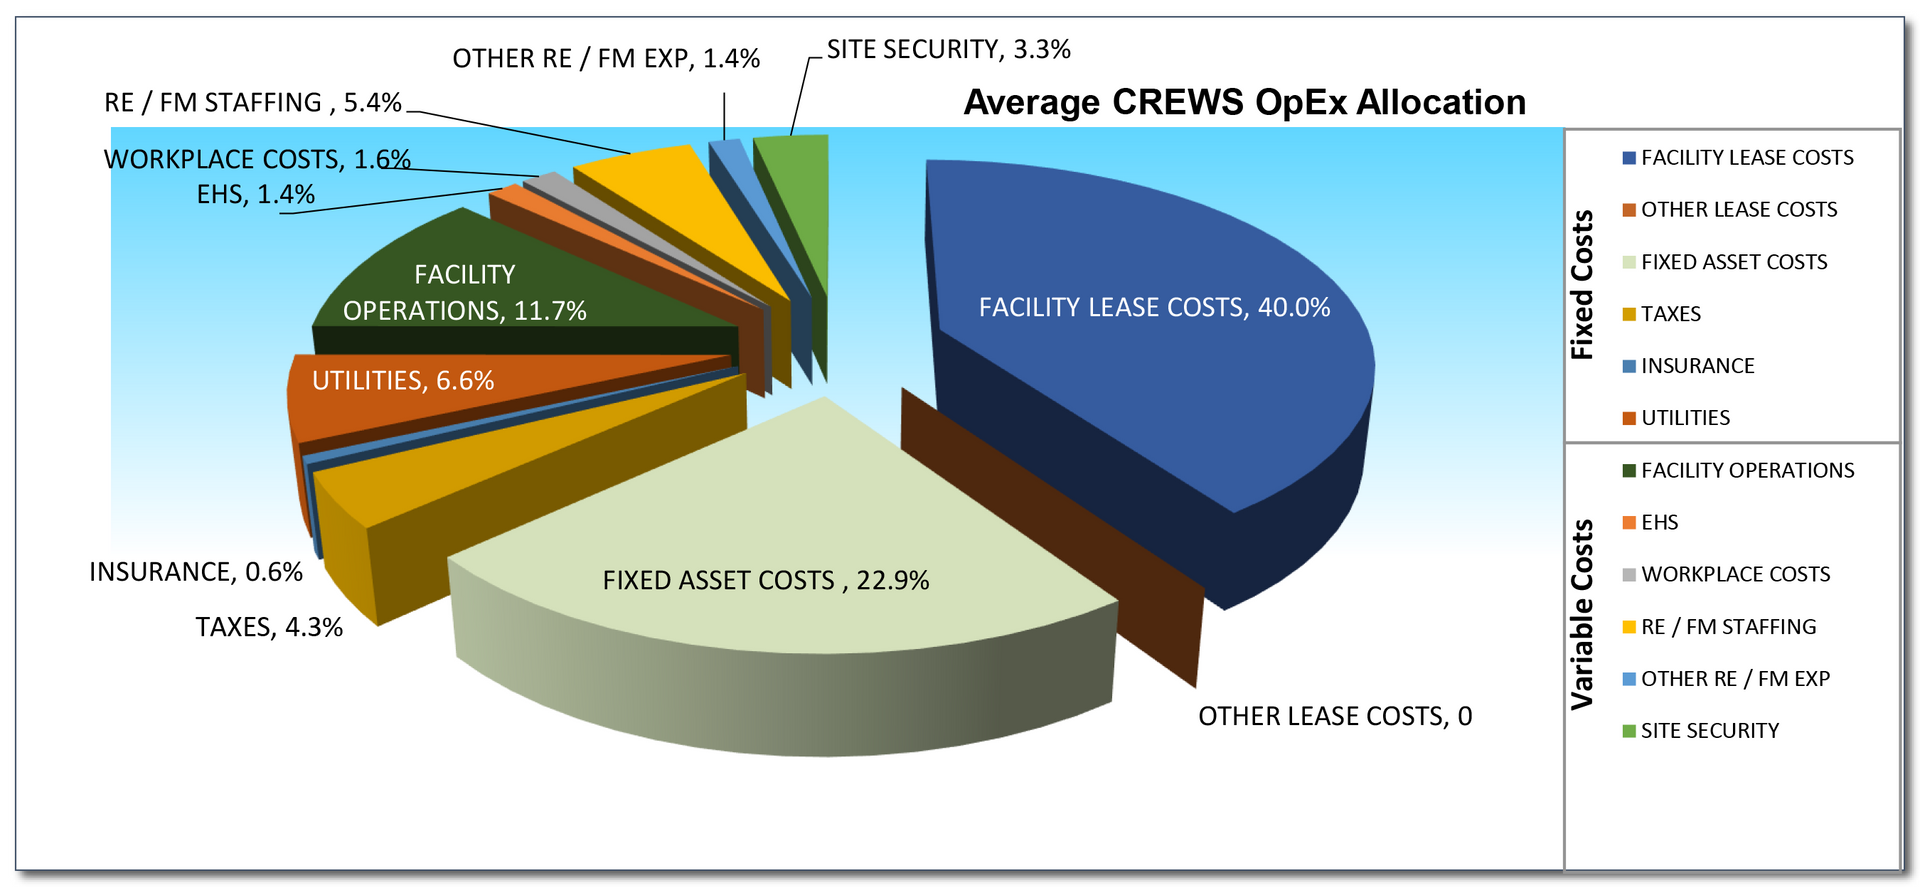
TO BENCHMARK YOUR ORGANIZATION ON THIS OR OTHER CHARTS, CONTACT US THRU “MORE INFO.”
TOTAL COST OF OCCUPANCY
AS A PERCENT OF REVENUE (CPRD)
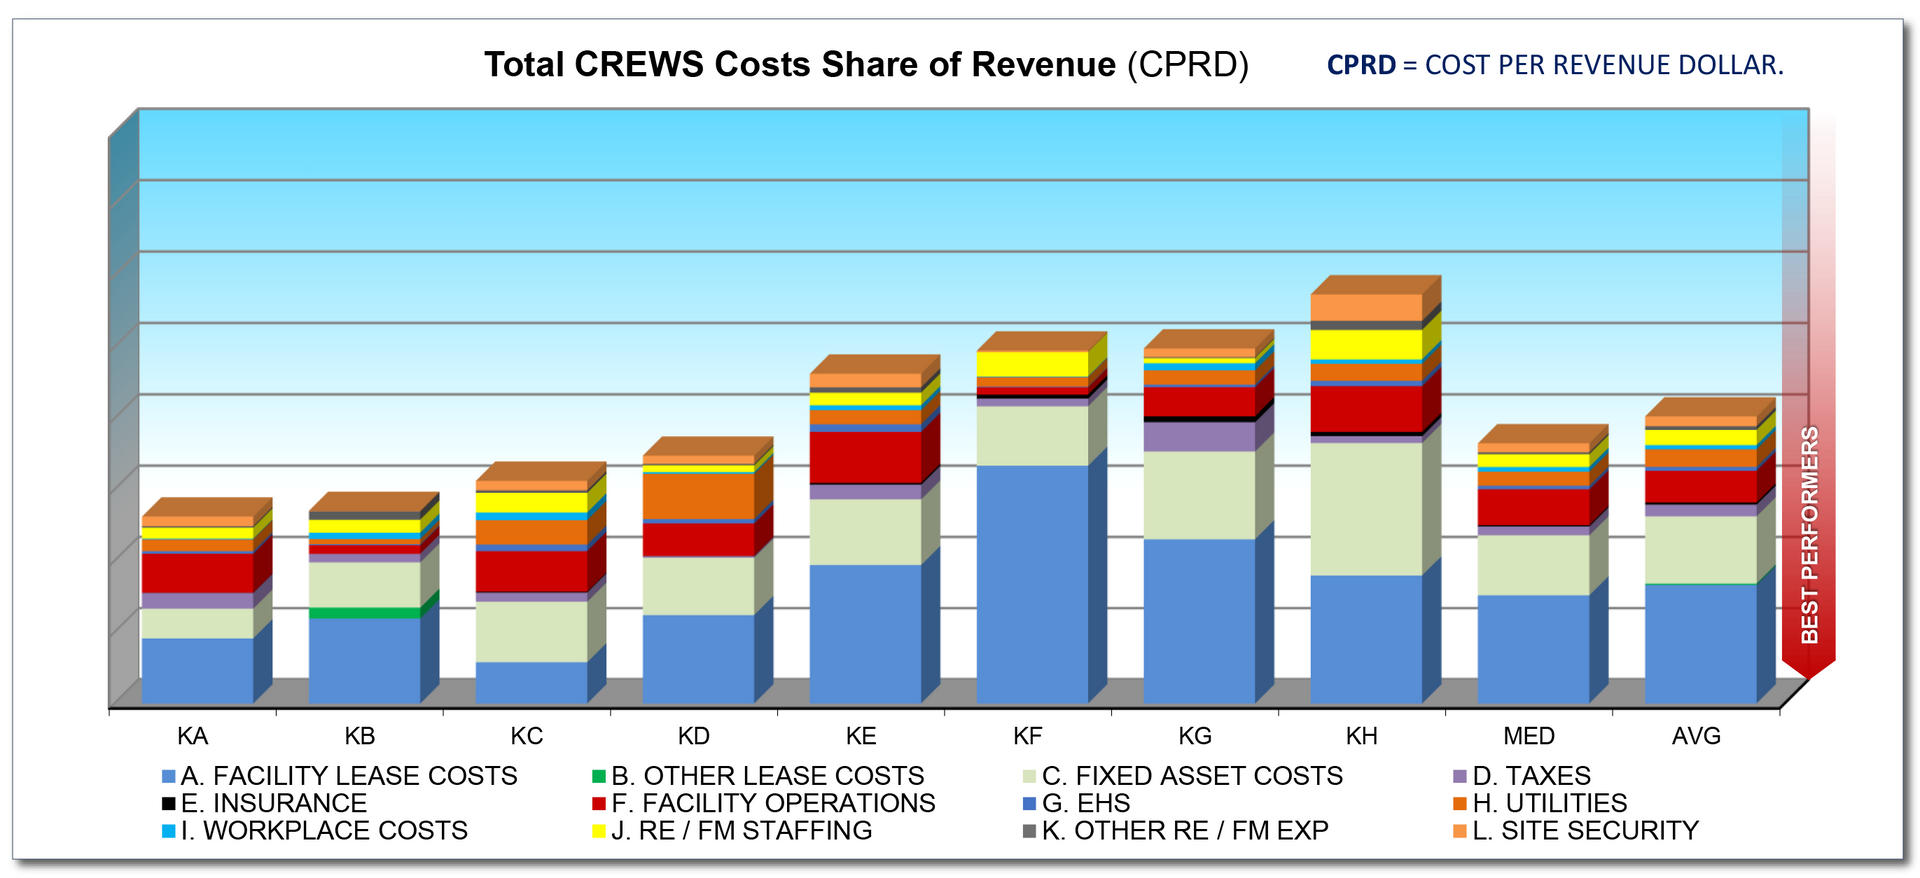
TO BENCHMARK YOUR ORGANIZATION ON THIS OR OTHER CHARTS, CONTACT US THRU “MORE INFO.”
AND OUTSOURCED STAFFING BY OCCUPANCY
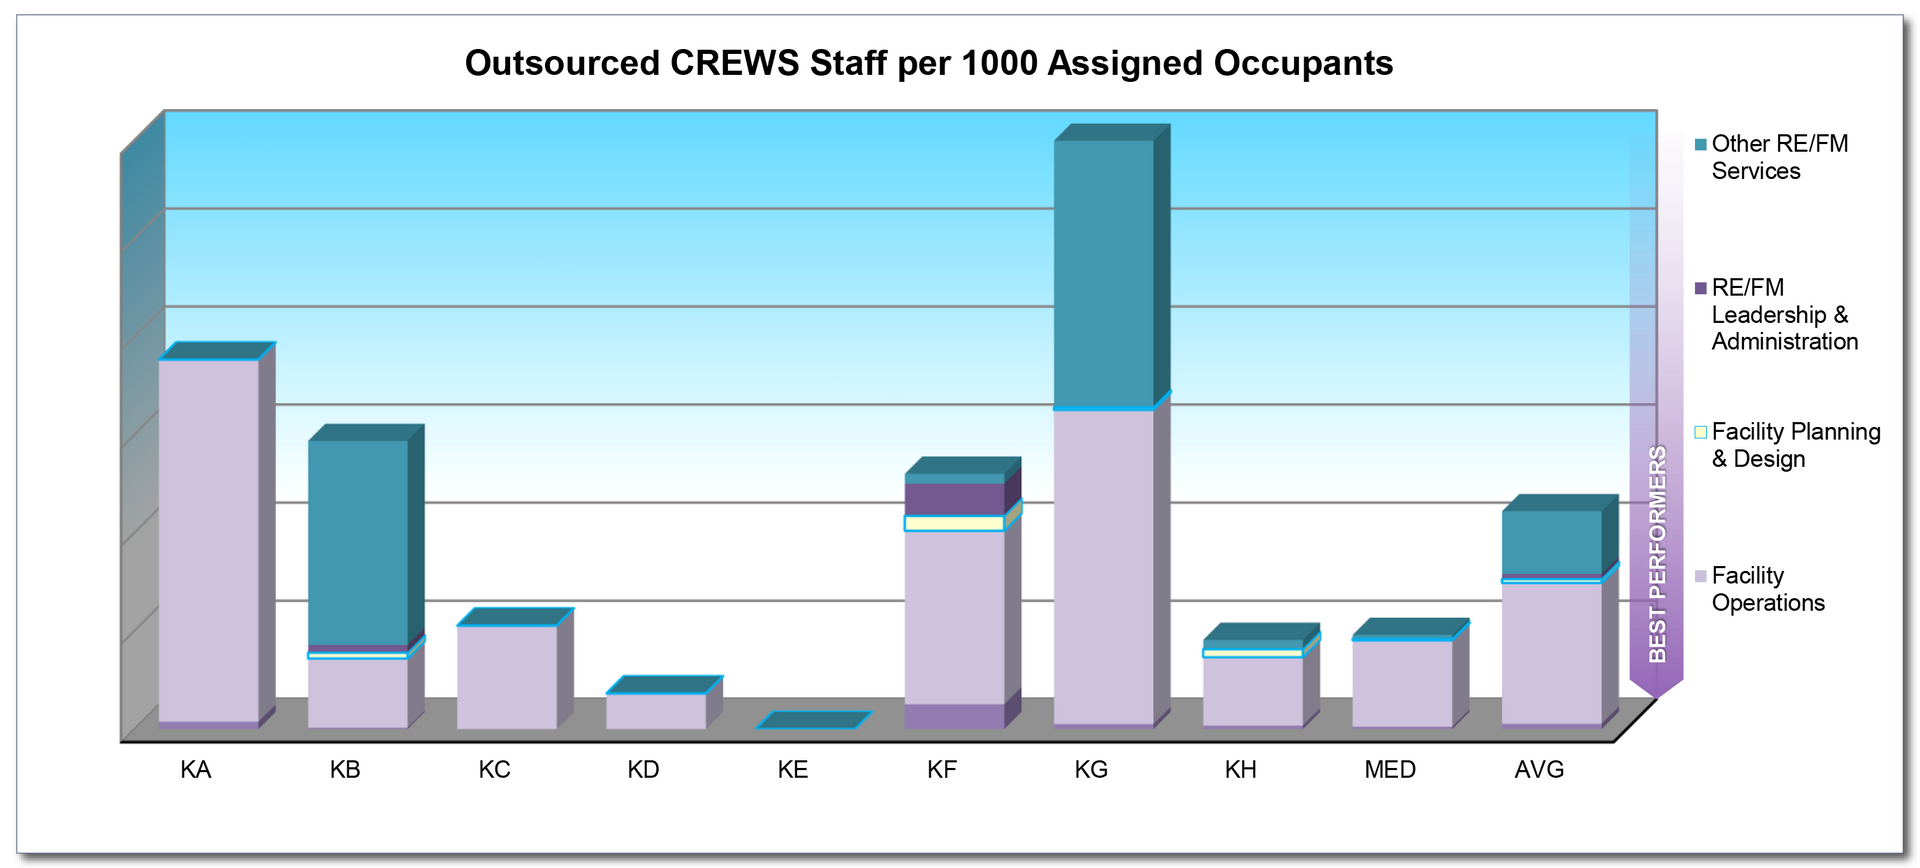
TO BENCHMARK YOUR ORGANIZATION ON THIS OR OTHER CHARTS, CONTACT US THRU “MORE INFO.”
BREAKDOWNS OF IN-HOUSE STAFFING BY BUILDING AREA

TO BENCHMARK YOUR ORGANIZATION ON THIS OR OTHER CHARTS, CONTACT US THRU “MORE INFO.”
RATES & COSTS OF SUB-UTILIZATION
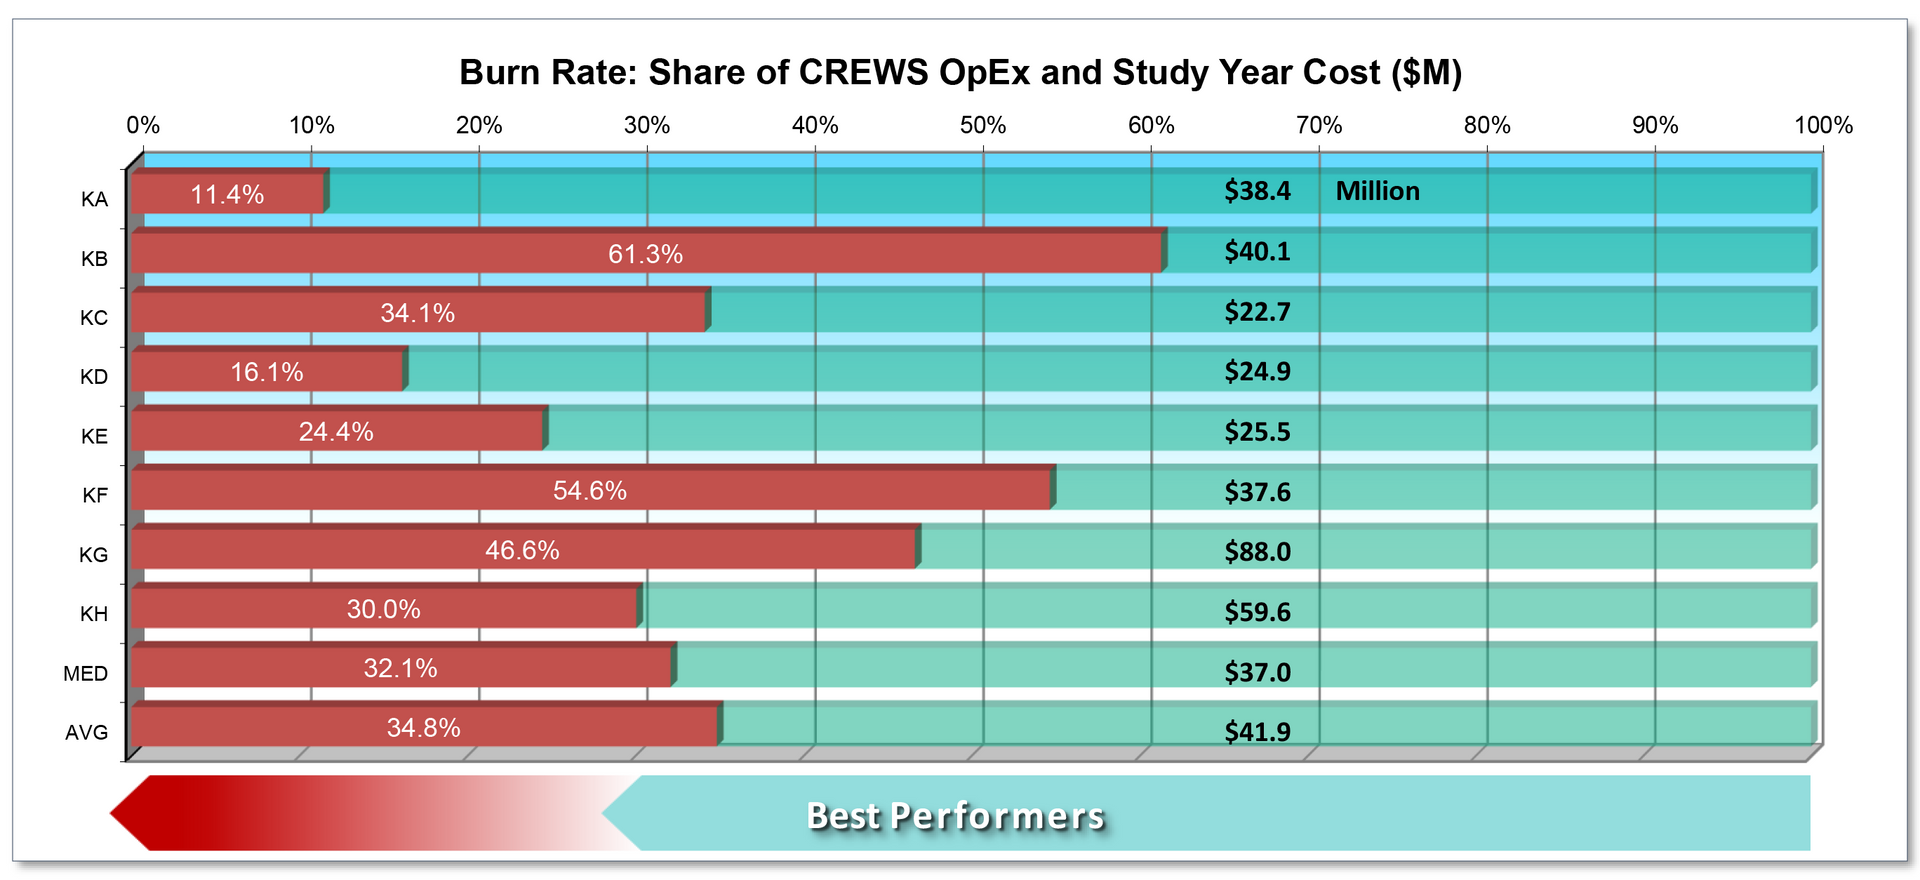
TO BENCHMARK YOUR ORGANIZATION ON THIS OR OTHER CHARTS, CONTACT US THRU “MORE INFO.”
CAPITAL SPENDING / REVENUE RATIOS
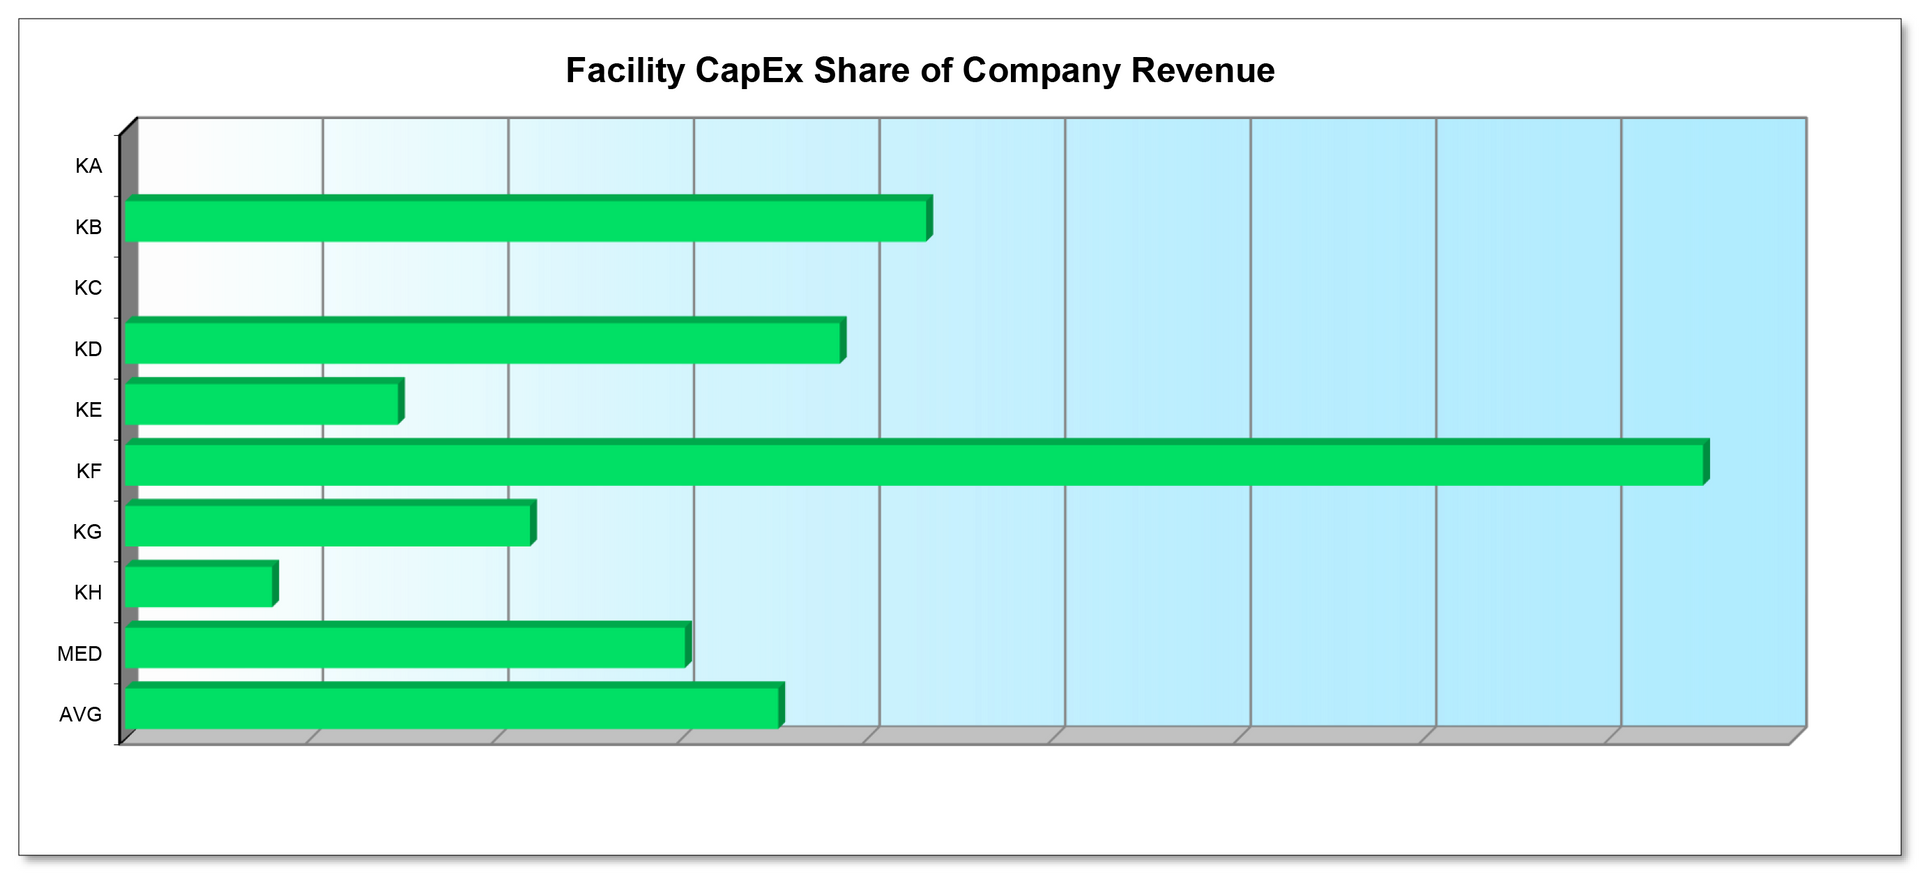
TO BENCHMARK YOUR ORGANIZATION ON THIS OR OTHER CHARTS, CONTACT US THRU “MORE INFO.”
REGIONAL LOCATIONS

TO BENCHMARK YOUR ORGANIZATION ON THIS OR OTHER CHARTS, CONTACT US THRU “MORE INFO.”
CONCLUSION
WHY IT’S IMPORTANT
It’s essential to establish measurable goals and achievements. Equally important is the need to ensure that these goals are both aggressive and realistically achievable. One way to strike the optimal balance between these opposing poles is to see what similar companies are achieving for their organizations.
This is especially true of direct competitors, where their lower costs may pose a threat to your own firm’s market competitiveness, while higher levels of performance (in employee amenities provided, for example) can represent a major threat in today’s highly competitive labor market.
Benchmarking directs improvement efforts into the most important areas. Where you are doing well, report this clearly to management; where you are fair, plan reasonable improvements; and if/where you perform poorly, seize the opportunity to set ambitious goals, reorganize programs and redesign key processes.
Benchmarking can introduce opportunities to establish robust new goals, envision and develop successful organizations, and adopt best practices, by learning from best performers in the study group and the industry.

HOW WE CAN HELP
We’ve conducted studies for a wide range of firms, many of them. leaders in their industries, who recognize the advantages of a leadership position. We provide them with rigorous, thoughtful evaluations based on our 25+ years of CREWS consulting experience, plus our prior 10+ years’ hands-on knowledge of the field.
Our evaluations show how to raise performance while reducing costs, by establishing and attaining aggressive but achievable goals for the organization. We can provide evaluations tailored to your own portfolio, facilities, workplace, staffing, and other management responsibilities, and help you become the best performer
THANK YOU!

TO BENCHMARK YOUR ORGANIZATION ON THIS OR OTHER CHARTS, CONTACT US THRU “MORE INFO.”
The post CREWS 7: Benchmarking – What, Why & How first appeared on GUERIN ASSOCIATES, INC.


The Window To World Class Performance Since 1996
PHONE:
EMAIL:
Address:
1936 Long Hill Road #285
Millington, NJ 07946